|
|
Introduction of research 1
Analysis of simulation data by virtual-reality system 1
Computer produces huge numerical data in the calculation process of simulation
research. It is difficult to know what happens in the simulation even when
you watch such the raw data. It becomes able to understand first the state
of the simulation when you adapt the data to an easy-to-understand expression,
such as, a graph and a contour plot of the numerical data.
Recently, a large-scale three-dimensional simulation has been performed
because of rapidly-advancing technology of super-computer. These data are
usually shown and analyzed on the two-dimensional plane through the monitor
by three-dimensional visualization software. However, since the depth information
is not sufficient, it is difficult or impossible to understand the spatial
structure of physical quantities, which are calculated in three-dimensional
space (ex. magnetic field structure, and the particle orbits). For this
reason, it is desirable to analyze the three-dimensional simulation results
in the three-dimensional space.
In this research, we performed an analysis by an immersive virtual-reality
system “CompleXcope” in order to understand the three-dimensional simulation
results in three-dimensional space. CompleXcope is composed of room-size
four screens for stereo and immersive view, liquid-crystal glasses with
tracking system for stereo and interactive view, and three-dimensional
mouse Wand for interactive view. Viewer with liquid-crystal glasses comes
into the room surrounded by the four screens. It is possible to see the
stereo and immersive view through the liquid-crystal glasses. When the
viewer moves its head or walks in the room, the images on the screens are
reconstructed rapidly according to its movement by tracking system. The
viewer feels itself being in the simulation model with high immersive feeling,
and it can watch the three-dimensional objects with any size and from all
directions.
By means of CompleXcope, we investigated the particle behavior in the electromagnetic
field obtained by simulation. As a result, it was clearly shown that the
particle motion which drew a complex three-dimensional orbit played an
important role in the magnetic reconnection phenomena. The visualization
software (VFIVE and its expansion version) can serve functions, which are
expected to be applied to other fields as well as the reconnection research.
It is worthy of attention as an important guiding principle for an establishment
of basic technology of simulation science and a progress of simulation
research.
Reference:“Scientific Visualization of Magnetic Reconnection Simulation
Data by CAVE Virtual Reality System”, H. Ohtani and R. Horiuchi, Plasma
and Fusion Research, 3, (2008), 054.
|
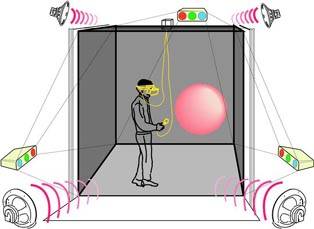
Immersive virtual-reality system“CompleXcope”.
|
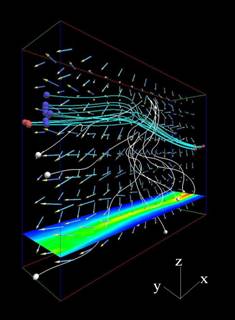
Scientific visualization of magnetic reconnection simulation by VFIVE expansion
version.
|
|
Introduction of research 2
Integrated scientific visualization of simulation and experimental device
data by virtual-reality system
We integrally visualize simulation results of equilibrium plasma in the
vacuum vessel of Large Helical Device (LHD) by CompleXcope. Since the experimental
device, data is based on CAD software, the devices such as diverter plates
and cyclotron heating antennae are located in the same positions as those
in the actual LHD vessel. Under the results of magnetohydrodynamics (MHD)
equilibrium simulation code "HINT," An isosurface of a plasma
pressure, a magnetic field line and an orbit of drift particle can be calculated
and displayed in VR space interactively. From this success, a lot of attractive
potentialities have opened up for intuitively understanding the physics
of plasma, for aiding in the design and arrangement of the devices, and
for confirming the field of vision from the observation port in VR space.
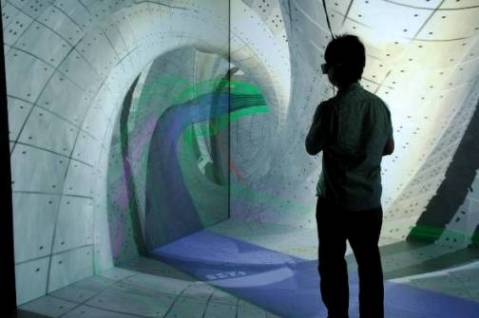
Integrated virtual-reality visualization of simulation and experimental
device.
Reference
“Scientific Visualization of Plasma Simulation Results and Device Data
in Virtual-Reality Space”, H.Ohtani, Y.Tamura, A.Kageyama, S.Ishiguro,
IEEE Transactions on Plasma Science Special Issue - Images in Plasma Science 2011, 39 (11), (2011), 2472-2473.
DOI:10.1109/TPS.2011.2157174
“Integrated Visualization of Simulation Results and Experimental Devices
in Virtual-Reality Space“,H.Ohtani, A.Kageyama, Y.Tamura, S.Ishiguro, M.Shohji,
Plasma and Fusion Research, 6, (2011), 2406027 (4pages). DOI: 10.1585/pfr.6.2406027
・H.Miyachi et al: IEEE Computer Society, (2005), 530.
・H.Miyachi et al: IEEE Computer Society, (2007), 536.
|
|
|
|
|
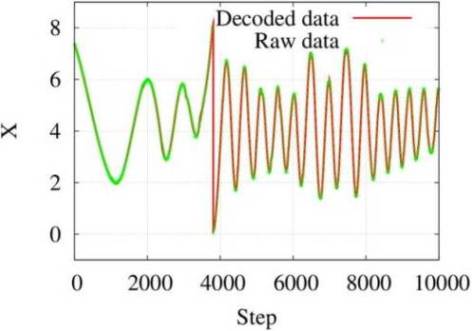
Reproducibility of the compressed data. Time evolution of the particle
x coordinate of three-dimensional plasma particle simulation is shown.
Red line indicates the decoded data, and green plus symbol shows the simulation
data.
- Reference:
(1) H.Ohtani, K.Hagita, A.M.Ito, T.Kato, T.Saitoh and T.Takeda: Journal
of Physics: Conference Series, accepted (2013).
|
Introduction of simulation code
Name: VFIVE
- Subject: To analyze interactively and three-dimensionally the three-dimensional
field data, such as the flow and magnetic fields, with a deep absorption
into the data space.
- Function: Input data are the multiple scalar and vector fields defined
on the Cartesian coordinate. It serves basic visualization functions, such
as isosurface, cross section, volume rendering, streamline, arrow expression
of vector field. It also serves original functions, which bring out the
best in the virtual-reality interactive environment.
- Features: It is possible to analysis the data interactively reflecting
the characteristics of the virtual-reality, for example, release of tracing
particles from the three-dimensional mouse one after another, observation
of movement of several hundred tracing particles, which seem like dancing,
blown by the wind, in the virtual spot light radiated from the mouse.
- Reference:
(1) Nobuaki Ohno, and Akira Kageyama, Region-of-Interest Visualization
by CAVE VR System with Automatic Control of Level-of-Detail, Comput. Phys.
Comm., vol.181, pp.720-725 (2010)
(2)A. Kageyama, and N. Ohno, Interactive Three-Dimensional Visualization
Software by Virtual Reality Technology, Journal of Plasma and Fusion Research,
vol.84, No.11, pp.834--843 (2008)
(3) N. Ohno and A. Kageyama, Scientific Visualization of Geophysical Simulation
Data by the CAVE VR System with Volume Rendering, Phys. Earth Planet. Interiors,
vol.163, pp.305--311, doi:10.1016/j.pepi.2007.02.013 (2007)
(4) N. Ohno, A. Kageyama, and K. Kusano, Virtual Reality Visualization
by CAVE with VFIVE and VTK, J. Plasma Physics., J. Plasma Physics, vol.72,
part 6, pp.1069-1072 (2006)
(5) Akira Kageyama, Yuichi Tamura, and Tetsuya Sato, Visualization of Vector
Field by Virtual Reality, Progress of Theoretical Physics Supplment, Vol.
138, (2000), pp.665-673
(6) Akira Kageyama, Yuichi Tamura, and Tetsuya Sato, Scientific Visualization
in Physics Research by CompleXcope CAVE System, Transactions of the Virtual
Reality Society of Japan, Vol.4, No.4 (1999) pp.717-722
|